Elevational pattern of bird species richness and its causes along a central Himalaya gradient, China
The article titled “Elevational pattern of bird species richness and its causes along a central Himalaya gradient, China” was published on November 2, 2016, in the journal PeerJ. It was accepted on September 30, 2016, and received on June 14, 2016. The academic editor for the article was David Roberts, and the subject areas it covered included biodiversity, biogeography, conservation biology, ecology, and zoology. The article explored the relationship between bird species richness and elevational patterns, as well as the environmental and spatial factors that contribute to these patterns. The article is available under the Creative Commons Attribution License, which allows for unrestricted use, distribution, reproduction, and adaptation as long as the original authors, title, publication source (PeerJ), and DOI or URL are properly cited. The authors of the article are Pan X, Ding Z, Hu Y, Liang J, Wu Y, Si X, Guo M, Hu H, and Jin K.
Abstract
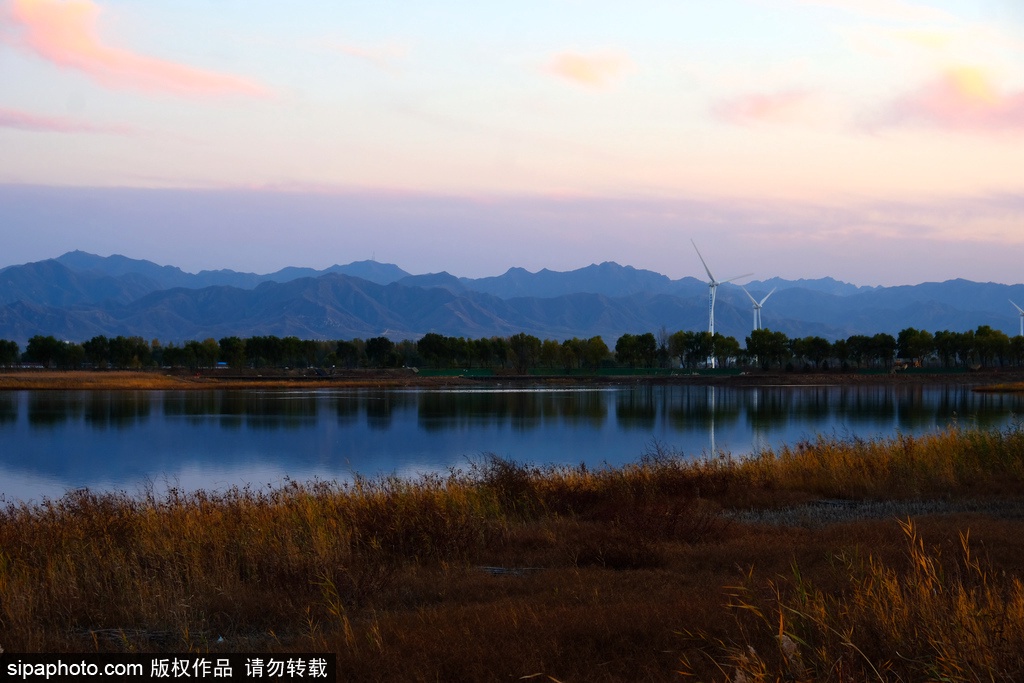
In this study, we investigated the elevational patterns of species richness for breeding birds along a central Himalaya gradient in the Gyirong Valley, the longest of five canyons in the Mount Qomolangma National Nature Reserve. Our research focused on six variables, including area, temperature, precipitation, productivity, habitat heterogeneity, and the mid-domain effect, to determine their relative importance. To conduct our research, we surveyed twelve elevational bands of 300 m between 1,800 and 5,400 m asl, four times during the entire wet season. Our survey resulted in the recording of 169 breeding bird species, with 74% of them being small-ranged. We found that the species richness patterns for overall, large-ranged, and small-ranged birds were all hump-shaped, with peaks at different elevations. Furthermore, we observed that large-ranged species and small-ranged species contributed equally to the overall richness pattern.
In a recent study of bird species richness along a central Himalaya gradient in the Gyirong Valley, researchers discovered some interesting patterns related to the various factors that shape species richness in this area. Through bivariate and multiple regression analyses, the researchers found that area and precipitation were not significant factors in determining species richness in this gradient. Instead, the mid-domain effect played a vital role in shaping the richness pattern of large-ranged species. The results also showed that temperature had a negative correlation with overall and large-ranged species but a positive correlation with small-ranged species. Productivity emerged as a strong explanatory factor across all bird groups, while habitat heterogeneity played an essential role in shaping the elevational richness patterns of overall and small-ranged species.
These findings have significant implications for conservation efforts in the region. The results suggest that primary forest and intact habitat conservation are crucial for maintaining the rich bird species diversity in the area. Moreover, given the increasing anthropogenic activities and land use pressure, there is an urgent need to increase conservation efforts in this montane biodiversity hotspot. By understanding the key factors that shape species richness patterns, conservationists can better target their efforts to preserve the bird species diversity of the central Himalaya gradient in the Gyirong Valley.
Introduction
The variation in biodiversity across geographical locations is a prominent pattern in biology that has fascinated naturalists and biogeographers since the time of Darwin and Wallace. However, the urgency to understand this variation has increased in recent years due to the risk of mass extinction caused by human activities (Dirzo & Raven, 2003; Wiens, 2011). Altitudinal gradients have become a popular subject for studying the underlying mechanisms of spatial variation in diversity, offering several advantages compared to latitudinal gradients such as globally replicated gradients, smaller spatial scale, and constancy in ecological and historical context of the faunal assemblage. Altitudinal gradients have received significant attention in recent decades.
In the study of geographical variation in biodiversity, the traditional assumption has been that species richness decreases with increasing elevation due to lower temperatures and productivity. However, standardized analysis of area effects and sampling effort has revealed different elevational patterns, which can be grouped into four categories: decreasing richness with elevation, a plateau with a decline, a plateau with a mid-elevation peak, and a unimodal mid-elevation peak. There have been numerous hypotheses proposed to explain the linear and humped relationships between species richness and altitude, with spatial factors such as area and mid-domain effect (MDE) and environmental factors such as climate, productivity, and habitat heterogeneity being the most frequently cited explanations for the variation in species richness. These findings are crucial in understanding the underlying mechanisms of spatial variation in diversity and in developing effective conservation strategies to protect biodiversity in different regions.
According to research, area has been identified as a significant factor in shaping species richness patterns along elevational gradients (Rahbek, 1997). This finding has been supported by subsequent studies (Fu et al., 2004; Kattan & Franco, 2004; McCain, 2005; Williams et al., 2010). The mid-domain effect (MDE) refers to the increased overlap of species ranges toward the center of a bounded domain due to geometric constraints (Colwell & Hurtt, 1994; Colwell, Rahbek & Gotelli, 2004). It has been suggested that the MDE accounts for a significant portion of the variation in species richness along elevational gradients (McCain, 2004; Cardelús, Colwell & Watkins, 2006; Kluge, Kessler & Dunn, 2006; Rowe, 2009; Wu et al., 2013a; Wu et al., 2013b).
Biodiversity patterns are influenced by various environmental factors, with climate being one of the most widely supported predictors. Mean annual temperature (MAT) and mean annual precipitation (MAP) are commonly used to capture the influence of climatic variables on biodiversity patterns. These variables can have both direct and indirect effects on biodiversity, affecting physiological tolerances and food resource availability, respectively.
The niche conservatism hypothesis suggests that most modern species originated during the time when the majority of the Earth was experiencing tropical-like conditions, and they tend to retain their ancestral ecological characteristics. This hypothesis implies that regions characterized by warm temperatures and abundant rainfall will have high species richness.
Numerous studies have supported the climate-richness relationship worldwide, with temperature and precipitation being identified as important predictors of biodiversity patterns. These environmental factors can have complex and interactive effects on biodiversity, and their influence can vary across spatial scales and taxonomic groups.
Understanding the relationship between climate and biodiversity patterns is crucial for predicting and mitigating the potential impacts of climate change on biodiversity. Climate change is projected to have significant impacts on biodiversity, with potential consequences including altered species distributions, changes in phenology and productivity, and increased risk of extinction.
Therefore, it is essential to continue monitoring and researching the relationship between climate and biodiversity patterns, as well as developing effective conservation strategies to protect and preserve biodiversity in the face of climate change.

Biodiversity patterns are influenced by various environmental factors, including energy availability, habitat heterogeneity, and climatic conditions. One hypothesis, the energy-diversity hypothesis, proposes that increased energy availability leads to more species rather than larger populations of existing species. Primary productivity, measured using the normalized difference vegetation index (NDVI), is often used as a proxy for energy availability. Studies on birds have shown a positive relationship between NDVI and species richness.
The habitat heterogeneity hypothesis suggests that greater structural complexity in vegetation and more habitat types can provide more resources, thus supporting a larger number of species. However, measuring habitat heterogeneity is often challenging due to its dependence on taxa studied and the scale of the study. Nonetheless, studies that have accounted for habitat heterogeneity have often shown a significant positive role in shaping species richness patterns.
Climatic variables, particularly mean annual temperature (MAT) and mean annual precipitation (MAP), are also considered to be important environmental predictors of biodiversity patterns. Both variables can affect biodiversity directly through physiological tolerances and indirectly by affecting food resource availability. The niche conservatism hypothesis further proposes that most modern species originated during tropical-like conditions and tend to retain their ancestral ecological characteristics, resulting in high species richness in regions characterized by warm temperatures and abundant rainfall.
Overall, biodiversity patterns are shaped by multiple factors, including energy availability, habitat heterogeneity, and climatic conditions. Understanding the interplay between these factors is crucial for developing effective strategies for biodiversity conservation and management.
Traditionally, studies on the determinants of geographic patterns in species richness have focused solely on overall species richness patterns. However, since wide-ranging species have a larger number of distribution records, their contribution to the species richness counts is disproportionate compared to narrow-ranging species. As a result, it is necessary to consider the influence of the geographic range size on our understanding of what determines species richness (Jetz & Rahbek, 2002). Certain studies have demonstrated that the elevational diversity of large-ranged and small-ranged species is determined by different patterns and processes (Cardelús, Colwell & Watkins, 2006; Kluge, Kessler & Dunn, 2006; Wu et al., 2013b).
Despite two centuries of research, there is still disagreement on the mechanisms that drive species richness patterns along elevational gradients (Rahbek, 2005; Rowe, 2009). By comparing independent transects and analyzing similarities and differences in patterns among transects and taxa in various climates and biogeographic regions, we can improve our understanding of the mechanisms that underlie biodiversity patterns (Grytnes & McCain, 2007). The Himalayas are home to the world’s highest mountains, which include a diverse range of eco-climate zones (Dobremez, 1976) and are considered one of the world’s biodiversity hotspots (Myers et al., 2000). Mountains with a broad range of elevation, such as the Himalayas, have been suggested to be ideal systems for studying elevational diversity (Acharya et al., 2011).
Prior research in the region has mainly focused on flora and reptiles, revealing a dominant unimodal pattern. One previous study in the Nepal Himalayas discovered that bird species richness declined with increasing elevation. However, two descriptive studies from the central Himalayas in China showed hump-shaped richness patterns of overall bird species. Other studies have found that bird species richness along an eastern Himalaya gradient peaked at mid-elevations, and a study of songbirds in the eastern Himalayas showed a hump-shaped elevational richness pattern that was explained by resource availability. One study of birds in the western Himalayas showed a hump-shaped elevational richness pattern and a significant correlation between species richness and vegetation structure. The mechanisms underlying elevational patterns may vary even among gradients with similar biogeographic histories and fauna. Thus, new, well-designed elevational studies and integrative analyses of biodiversity along central Himalaya gradients in China are important for understanding these complex patterns and their underlying mechanisms, and for the management and conservation of biodiversity.
This study aims to record the patterns of elevational species richness of birds by analyzing data gathered from a field survey conducted in the Gyirong Valley, situated on the southern slope of the central Himalayas in China. Furthermore, the study intends to determine how well two spatial factors (area and MDE) and four environmental factors (MAT, MAP, NDVI, and HH) can account for the observed elevational patterns in bird species richness.
Materials and Methods
Study area
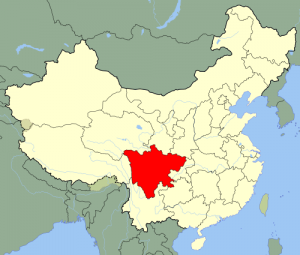
The Gyirong Valley, depicted in Figure 1, is the longest of the five canyons in the Mount Qomolangma National Nature Reserve, and it is characterized by a transitional zone between the Oriental and Palearctic regions. This valley has a diverse range of geological formations, varied geomorphic types, and abundant biodiversity, spanning from 1,680 to 5,770 meters above sea level. Its total area measures 2,612 km2. This valley falls within the subtropical monsoon climate zone and is influenced by warm, moist air from the Indian Ocean, leading to distinct wet and dry seasons. The rainy season lasts from May to October, with the majority of rainfall occurring between July and September, while the dry season extends from November to April.
Figure 1: Location of the study area.

The research area consists of 12 elevation bands, with each band having a midpoint assigned a number from 1 to 12. These midpoints are distributed along transect lines in each band, with band 1 being the lowest and band 12 being the highest.
The elevational gradient in the study area is characterized by the presence of five distinct vegetation zones, which have been previously identified (Feng, Cai & Zheng, 1986; The Comprehensive Scientific Expedition to Qinghai-Xizang Plateau, Chinese Academy of Sciences, 1988): evergreen broadleaf forest (1,700–2,500 m asl), coniferous and broadleaf mixed forest (2,500–3,300 m asl), dark coniferous forest (3,300–3,900 m asl), shrub and grass (3,900–4,700 m asl) and alpine tundra with sparse grass (4,700–5,500 m asl).
Bird surveys
Prior to conducting field surveys, we obtained research permits from the Mount Qomolangma National Nature Reserve. No birds were captured during the survey period, and field surveys were conducted between elevations of 1,800 to 5,400 m asl due to geographic limitations. The study area was divided into 12 elevational bands of 300 m, and each band was surveyed with three transect lines covering all habitat types. The length of transect lines varied from 2,000 to 3,000 m. To prevent biased sampling from affecting species richness patterns, we limited the total length of all transect lines in each band to 7.5 km to ensure even sampling effort across the gradient.
Using the standard line transect method (Bibby et al., 2000), we employed a handheld GPS (Magellan eXplorist 310) to record the presence, abundance, and position of bird species. To ensure the detection of rare or elusive species, bird surveys were conducted four times during the wet season (May-June, August, September-October 2012, and July-August 2013) along all transect lines. The surveys were conducted from 30 minutes after dawn to 11 AM and from 3 PM until 30 minutes before sunset, avoiding mid-day and inclement weather when bird activity is low. The Zheng (2011) taxonomic system was used for classification.
Species ranges
Breeding birds, including resident birds and summer visitors, were used for subsequent analyses to avoid potential bias in elevational range size associated with seasonal, long-distance migrants (McCain, 2009; Wu et al., 2013b). The occurrence of a species within an elevational band was assumed if it was observed in higher and lower elevational bands (Colwell & Hurtt, 1994; Colwell, Rahbek & Gotelli, 2004), which is a widely accepted interpolation method (Rahbek, 1997; Brehm, Colwell & Kluge, 2007; Wu et al., 2013b) and avoids underestimation of bird diversity due to insufficient surveying at both temporal and spatial scales. The range size of each species was transformed to “n × 300” m, where “n” represents the interpolated range of the species distributed over “n” elevational bands, for subsequent analyses.
Spatial factors
Area
In a recent study, researchers used GDEM 30-m digital elevation data from the International Scientific & Technical Data Mirror Site, Computer Network Information Center, Chinese Academy of Sciences to calculate the amount of three-dimensional surface area for each 300-m elevational band in ArcGIS 10.2.
GDEM, or Global Digital Elevation Model, is a product of the Advanced Spaceborne Thermal Emission and Reflection Radiometer (ASTER) Global Digital Elevation Model Project, which provides high-resolution elevation data for various regions across the globe. In this study, GDEM 30-m digital elevation data was used to determine the amount of surface area within each 300-m elevational band.
ArcGIS, on the other hand, is a geographic information system software that allows for the visualization and analysis of geospatial data. It was used in this study to process and analyze the GDEM data.
The results of this study can have implications for understanding the distribution and diversity of bird species along elevational gradients. By calculating the amount of surface area within each 300-m elevational band, the researchers were able to better estimate the range size of bird species and potentially identify areas of high biodiversity.
Overall, the use of digital elevation data and geographic information system software can provide valuable insights into the ecological patterns and processes that shape the natural world.
The mid-domain effect
To generate a predicted species richness pattern under geometric constraints, we used RangeModel 5 (Colwell, 2008; http://purl.oclc.org/rangemodel) to randomize the empirical species ranges within the bounded domain (without replacement). This was done without any assumption of environmental gradients within the domain, as detailed in Colwell & Lees (2000). For each 300-m band, we calculated predicted values and their 95% confidence intervals based on the average of 5,000 simulations of the geometrically constrained null model.
Environmental factors
Mean annual temperature and mean annual precipitation
The WorldClim database (http://www.worldclim.org) provides fine-scale climatic datasets that cover the entire planet. These datasets are based on information from many meteorological stations and are extrapolated statistically to regions without meteorological stations using digital elevation models (Hijmans et al., 2005). We extracted digital maps from the WorldClim database, which have a horizontal grid spacing of 30 arc-seconds and include information on elevation, mean annual temperature, and mean annual precipitation from 1950 to 2000. In each 300-m band, we obtained the values of temperature and precipitation by averaging all grid cells within the band based on the elevational value of each grid cell using ArcGIS 10.2 (ESRI, Redlands, CA, USA).
Productivity
To determine the above-ground net primary productivity, we utilized the NDVI data for the Gyirong Valley from the Ministry of Environment Protection of the People’s Republic of China (available at http://www.zhb.gov.cn). Using ERDAS IMAGINE 9.2 (ERDAS, Norcross, GA, USA), we averaged the NDVI data for each elevational band over a period of four years (2011-2014).
Habitat heterogeneity
In a study of the Gyirong Valley, the Shannon diversity index was used to summarize habitat heterogeneity (HH). The Shannon diversity index is commonly used to assess landscape-scale habitat diversity. The study utilized the GlobCover land cover data from CNIC, CAS and a 30-m digital elevation model (DEM) of the Gyirong Valley to calculate the area for each land-cover type in each 300-m elevational band using ArcGIS 10.2. The land-cover types were classified into twenty-two categories, which primarily reflect the anthropogenic land use and the different types of forest, woodland, shrubland, and herbaceous communities. By combining these data, the study was able to assess the habitat heterogeneity at a fine scale and determine its potential impact on biodiversity in the area.
Data analyses
Elevational patterns in species richness have long been a topic of interest among ecologists, and range size is known to play a role in determining these patterns. In a recent study, researchers aimed to investigate the effect of range size on the determinants of elevational patterns in species richness. To do so, they divided the overall species into two categories based on their range size.
The researchers used the median size of elevational range (1,800 m) to categorize species as either “large-ranged” or “small-ranged.” Species with ranges equal to or above the median size were placed in the “large-ranged” category, while those with ranges below the median size were placed in the “small-ranged” category.
This categorization allowed the researchers to compare the determinants of elevational patterns in species richness between the two categories of species. By doing so, they were able to gain insights into the potential influence of range size on the factors that shape species richness patterns in mountainous regions.
Understanding the factors that determine elevational patterns in species richness is important for predicting how species will respond to environmental changes in mountainous areas. By investigating the role of range size in these patterns, this study contributes to a better understanding of the complex relationships between species richness and environmental gradients in mountainous regions.
Detecting all species in natural communities is difficult in limited time and space. Therefore, non-parametric estimators such as Chao2 and Jackknife2 were used to calculate the estimated species richness, according to Colwell and Coddington (1994). These estimations were performed using the statistical software program EstimateS 9.0 (Colwell, 2013; http://purl.oclc.org/estimates). To assess whether the species diversity was adequately sampled for the elevational gradient, a regression of the observed species richness against the estimated species richness was performed.
Detecting all species in natural communities is difficult in limited time and space. Therefore, non-parametric estimators such as Chao2 and Jackknife2 were used to calculate the estimated species richness, according to Colwell and Coddington (1994). These estimations were performed using the statistical software program EstimateS 9.0 (Colwell, 2013; http://purl.oclc.org/estimates). To assess whether the species diversity was adequately sampled for the elevational gradient, a regression of the observed species richness against the estimated species richness was performed.
Sure! As a traveling photographer, I’m always on the lookout for beautiful and interesting things to capture through my lens. One of my favorite subjects to photograph are birds, and I’ve been lucky enough to see some really incredible species on my travels.
I vividly remember the time when I was in Costa Rica and spotted a resplendent quetzal perched on a branch. Its vibrant green and red feathers were absolutely stunning, and I was thrilled to be able to capture its beauty in a photograph.
Another memorable bird encounter was when I was in Australia and came across a group of kookaburras. These birds are known for their distinctive laugh-like call, and I was able to capture some amazing shots of them perched in the trees.
On a trip to South Africa, I was fortunate enough to witness a flock of flamingos taking off in unison. The sight of their wings beating in perfect unison against the backdrop of the ocean was truly breathtaking, and I was able to snap some incredible photos.
Whether it’s a majestic eagle soaring through the sky or a tiny hummingbird flitting among flowers, I’m always excited to capture the beauty and unique characteristics of each bird I come across on my travels. Being a traveling photographer has given me the opportunity to see some truly amazing sights, and I feel grateful to be able to share them with others through my photographs.
The researchers used multiple regressions to investigate the factors that influence bird species richness across elevational gradients. The study was conducted separately for overall species, large-ranged species, and small-ranged species. The team tested 63 different models, each including a combination of six variables: Area, MDE, MAT, MAP, NDVI, and HH. They selected the best model for each species group based on the lowest Akaike Information Criterion (AICc), which is a statistical measure of model fit that takes into account the number of explanatory variables used. In cases where multiple models had nearly equal AICc values, the team assessed the models based on the difference in AICc values (ΔAICc).
The results of any statistical analysis are only as good as the assumptions that underpin them. Two key assumptions that need to be considered when interpreting the results of the multiple regressions that we performed are spatial autocorrelation and multicollinearity among the explanatory variables.
Spatial autocorrelation refers to the phenomenon where observations that are geographically close to each other are more similar than observations that are far apart. In the context of our analysis, this could result in the residuals of our regression models being correlated with each other, potentially leading to biased results. To account for this, we used a spatial variable (MDE) in our partial regression analysis to partition out the unique contribution of spatial effects on species richness.
Multicollinearity, on the other hand, refers to the situation where two or more explanatory variables in a regression model are highly correlated with each other. This can make it difficult to interpret the individual effects of each variable on the response variable, and can lead to inflated standard errors and biased coefficients. To reduce multicollinearity, we conducted multiple OLS models without highly correlated variables, such as Area, AET, and AEP, which are highly correlated with NDVI.
While these methods can help to mitigate potential issues with spatial autocorrelation and multicollinearity, it is important to note that with a limited sample size, it is difficult to completely resolve these issues. As a result, we did not report P-values for our multiple regression models, and instead focused on identifying the best model using AICc. By doing so, we aimed to give a representative picture of the unique and shared contributions of the explanatory variables to the patterns of bird species richness in the Gyirong Valley.
| Area | |||||
| MAT | −0.993 * | ||||
| MAP | −0.993 * | 0.986 * | |||
| NDVI | −0.993 * | 0.986 * | 1 * | ||
| HH | 0.014 | −0.021 | 0 | 0 | |
| MDE | 0.126 | −0.14 | −0.112 | −0.112 | 0.93 * |